Gives genomics a shared evidence language.
Every variant. Every pipeline. Every institution.
Clinical genomic interpretation relies on heterogeneous evidence checks that vary across institutions and pipelines, preventing evidence from being compared or verified in a reliable way.
QuantBayes standardises how evidence strength is expressed, without changing how variants are discovered.
QuantBayes adopts a shared evidence standard. Foundational tools must be unrestricted so results can move safely between laboratories, hospitals, and national programmes.
Read moreQuantBayes does not estimate pathogenicity.
It does not replace analysis pipelines. It connects them.
QuantBayes measures how complete and verifiable the available evidence is for any variant selected by an upstream workflow. It applies a universal statistical standard that behaves identically across laboratories, platforms, and countries. Existing technologies remain unchanged while gaining a transparent, reproducible evidence scale that can move across institutions.
A strongly supported variant might score 0.95 with a 95 percent credible interval from 0.91 to 0.98. A weaker result might score 0.32 with a wider interval.
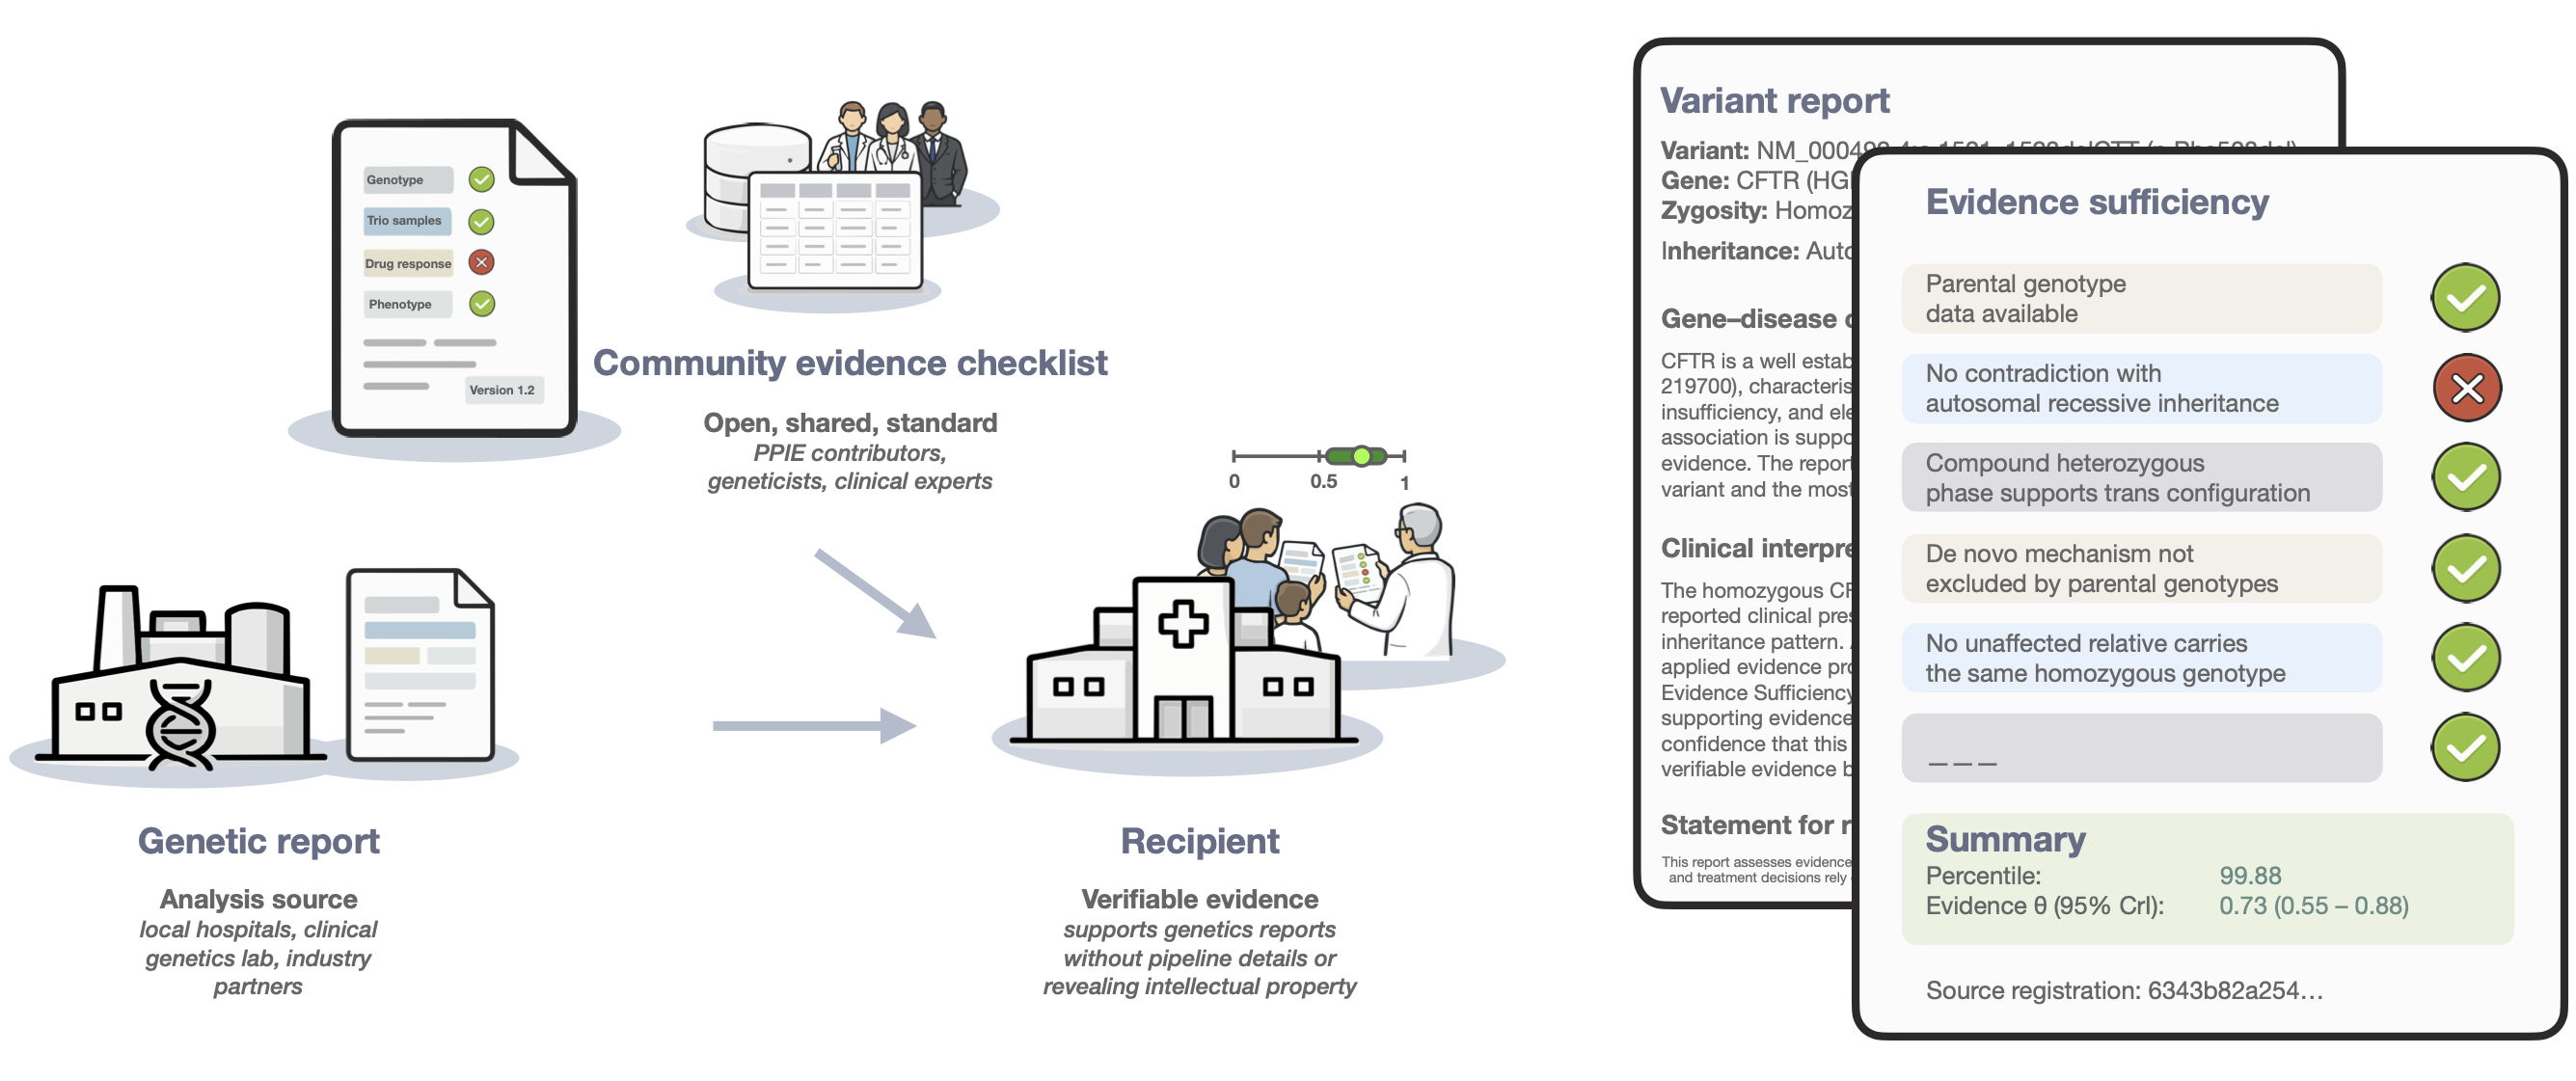
Figure 1. Pipeline-independent evidence sufficiency. Evidence completeness is summarised into a single, auditable metric that can be compared and reused across institutions, without exposing pipeline details or intellectual property.
These values are independent of the pipeline that produced the candidate variant. This separation of variant discovery from evidence assessment provides a common, auditable evidence language for genomics.
Most genomic interpretation failures are logistical, not statistical. QuantBayes is designed as non-diagnostic infrastructure suitable for regulated environments.
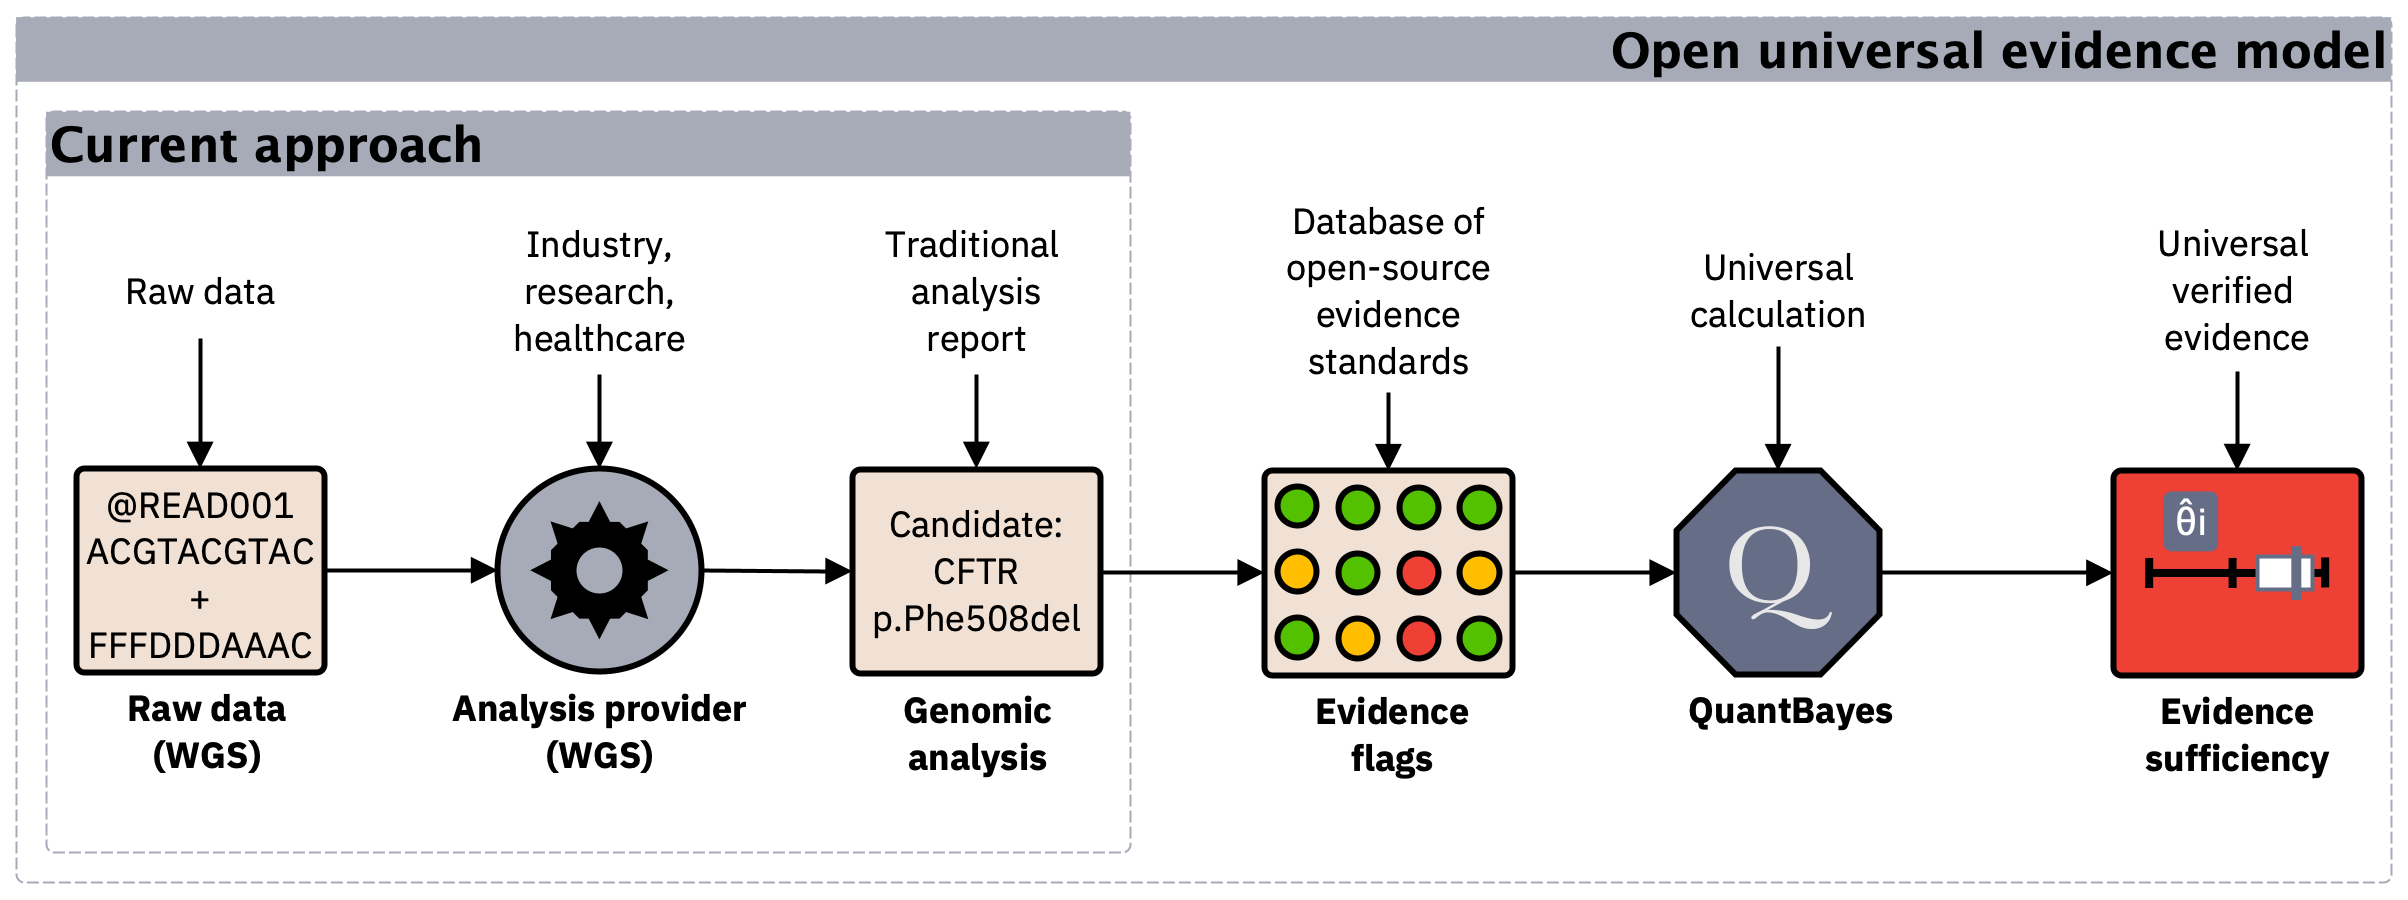
Figure 2. Making genomic evidence reusable. In current workflows, evidence is tightly coupled to analysis pipelines. A universal evidence model separates verifiable support from proprietary logic, enabling consistent comparison and reuse of results.
Downloads
| OS | File | SHA256 |
|---|---|---|
| R package | quantbayes_v0.1.0_R.tar.gz | dfa919d1848070cf8125d49eb029dbfd49d09558cd84deb7d50c1a6c188f1f63 |
| Linux x86_64 | quantbayes_v1.0.0_linux_x86_64.tar.gz | 440c5d92354285a5b7790d19f017205a849ecb76a4fc80804f726d420f06080d |
| macOS universal | quantbayes_v1.0.0_macos_universal.tar.gz | ab8824f0c29fce57328a3037677dbc20768b5a9d388fda1215362d1d3b99291e |
| macOS x86_64 | quantbayes_v1.0.0_macos_x86_64.tar.gz | c15d4ac299d4f557941b1a8518e75c44fd026cf9908edf8e85475b9f9e056035 |
R package
Source: cran.r-project quantbayes (for installation see below).
Installation
QuantBayes is distributed as a standalone binary and as an R package. The binary runs directly from the extracted directory and requires no system installation or administrator privileges. It is compatible with macOS, Linux, HPC environments, and shared compute clusters.
MacOS and Linux binary installation
Download verify checksums and extract:
shasum -a 256 quantbayes_v1.0.0_*.tar.gz
tar -xzf quantbayes_v1.0.0_<platform>.tar.gz
cd quantbayes
Run directly:
./quantbayes example_data/test_matrix_01.txt --report
macOS note
Downloaded binaries may be quarantined by macOS. Remove the quarantine flag if prompted:
xattr -d com.apple.quarantine quantbayes
Linux and HPC note
QuantBayes can be used from any directory with execute permissions. Administrators may optionally expose it via an environment module:
module load quantbayes
R package installation
Install with R or RStudio directly from CRAN. For more information see the R vignette and R reference manual pages.
install.packages("quantbayes")
library(quantbayes)
Quick start
Human readable report:
./quantbayes example_data/test_matrix_01.txt --report --out sample1
Minimal run:
./quantbayes example_data/test_matrix_01.txt
JSON output:
./quantbayes example_data/test_matrix_01.txt --json
QuantBayes produces per variant summaries, global summaries, and optional reports.
Example: clinical genetics
Whole Genome Sequencing produced a ranked list of candidate variants using a standard prioritisation workflow. QuantBayes evaluated the independent evidence supporting each candidate using a binary evidence matrix derived from a published evidence standard.
For the leading candidate, the posterior evidence sufficiency \(\theta\) and its 95 percent credible interval were 0.731 (0.549 to 0.879), corresponding to the 99.88th percentile genome wide. These values describe evidence completeness, not pathogenicity.
| variant_id | k | m | theta mean | theta lower | theta upper | percentile |
|---|---|---|---|---|---|---|
| 7-117559592-CTT–_AR | 18 | 24 | 0.7308 | 0.5487 | 0.8793 | 99.875 |
| 6-72183475-CG-N_AR | 18 | 24 | 0.7308 | 0.5487 | 0.8793 | 99.875 |
| 1-14682421-G-A_AD | 17 | 24 | 0.6923 | 0.5061 | 0.8505 | 99.375 |
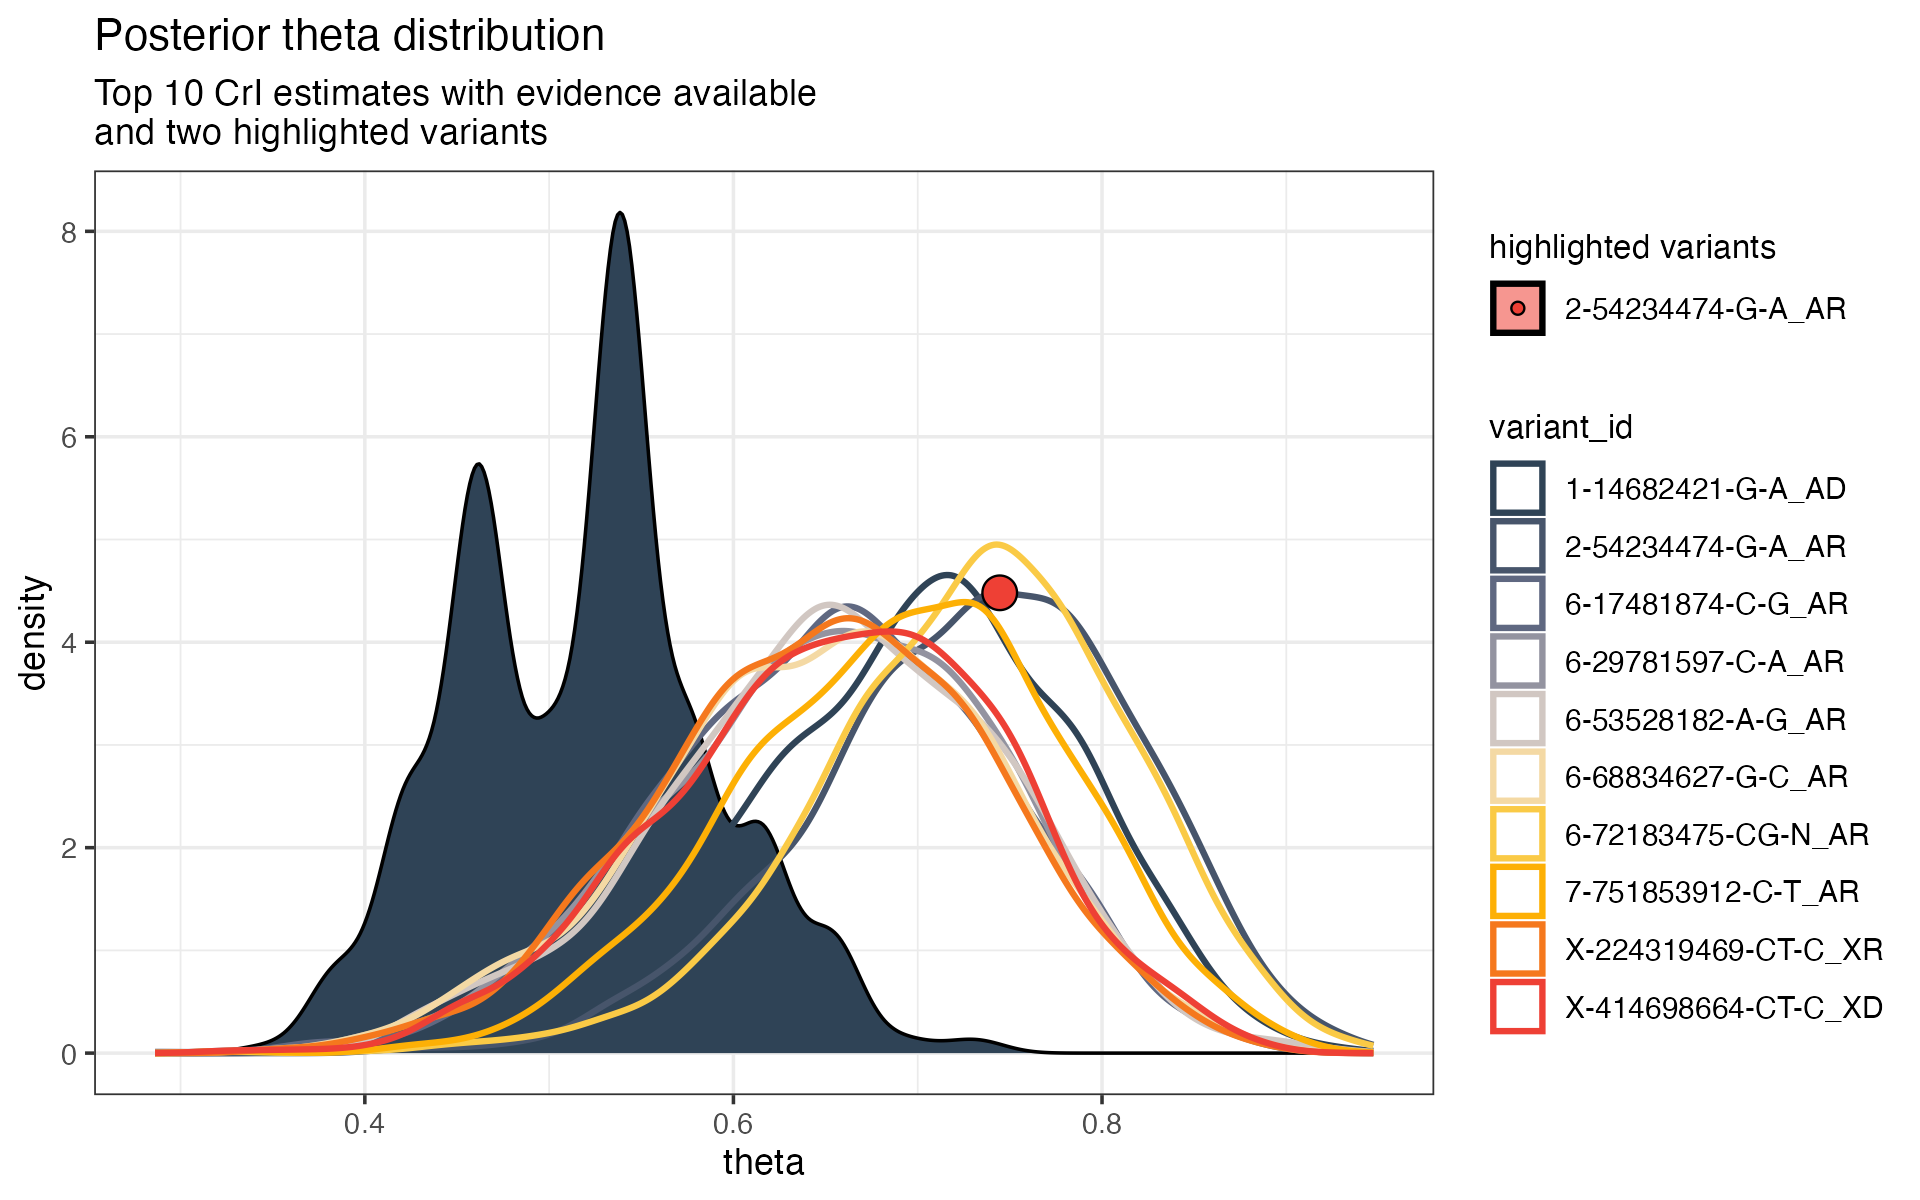
Figure 3. Placing candidate variants in genome-wide context. The global distribution of evidence sufficiency provides a reference against which individual candidate variants can be interpreted. Overlaying candidates shows not only their estimated support, but how exceptional that support is relative to all evaluated variants, with uncertainty preserved.
Method overview
QuantBayes models the number of supported evidence items (k) out of (m) using a Beta Binomial update:
\[\theta \mid k \sim \mathrm{Beta}(1 + k,\; 1 + m - k)\]The posterior mean, credible interval, and percentile provide a reproducible measure of evidence sufficiency. These values quantify completeness and verifiability of evidence and do not estimate disease causality.
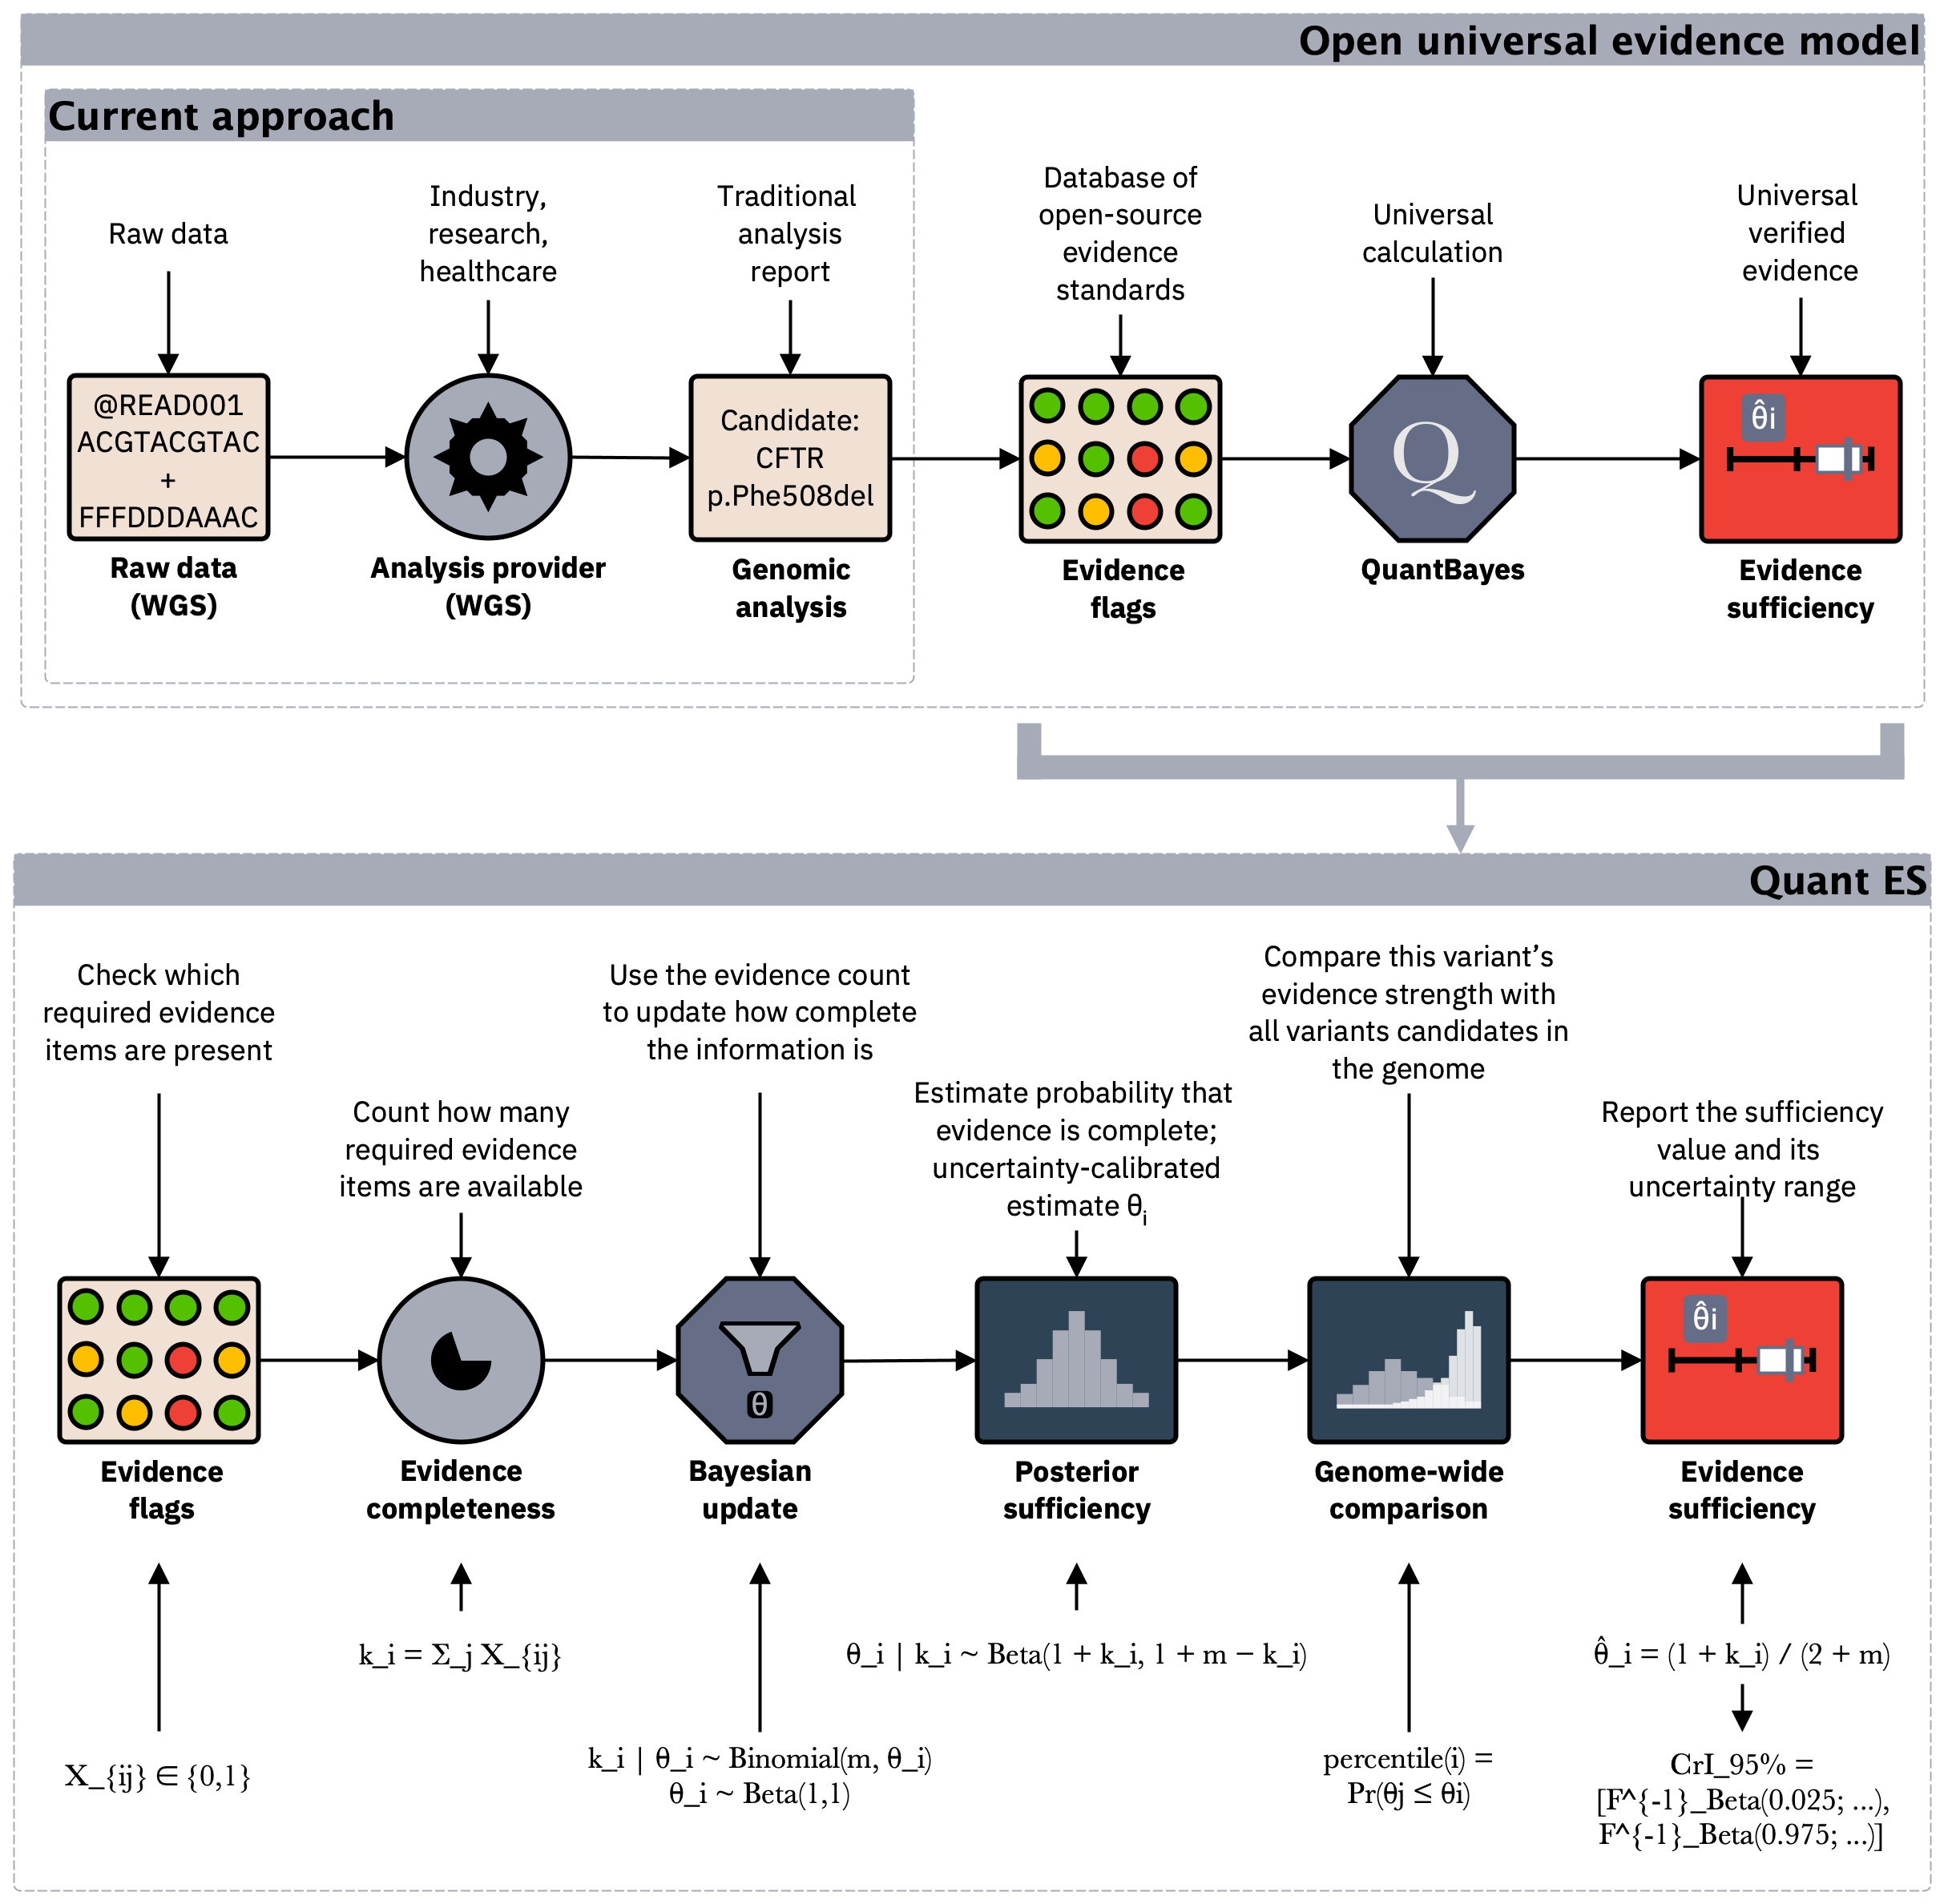
Figure 4. Under the hood, verifiable evidence is summarised using a Bayesian model to produce a single, uncertainty-calibrated metric that supports consistent interpretation and reuse across pipelines and institutions.
Evidence matrix standards
QuantBayes operates on a binary evidence matrix describing whether predefined, verifiable evidence criteria are satisfied for each variant.
For users who do not already maintain such a matrix, the Qualifying Evidence Matrix (QEM) standard provides a minimal, interoperable specification for encoding rule-based evidence in a portable and auditable form.
QEM is designed for settings where variant candidates may be produced by proprietary or opaque pipelines, but where the availability of supporting evidence must remain reproducible, independently verifiable, and suitable for reuse across institutions.
The standard is maintained by the Swiss Genomics Association and is available as both PDF and HTML specifications.
View the Qualifying Evidence Matrix (QEM) standard
Citation
If you use QuantBayes please cite the software and the associated manuscript.
Manuscript
Quant Group, et al. A Bayesian model for quantifying genomic variant evidence sufficiency in Mendelian disease. medRxiv (2025). DOI: https://doi.org/10.64898/2025.12.02.25341503.
@article{QuantBayes2025quantgroup,
  author    = {Quant Group and Saadat, Ali and Lawless, Dylan},
  title     = {A Bayesian model for quantifying genomic variant evidence sufficiency in Mendelian disease},
  elocation-id = {2025.12.02.25341503},
  year      = {2025},
  doi       = {10.64898/2025.12.02.25341503},
  publisher = {Cold Spring Harbor Laboratory Press},
  url       = {https://www.medrxiv.org/content/early/2025/12/13/2025.12.02.25341503},
  eprint    = {https://www.medrxiv.org/content/early/2025/12/13/2025.12.02.25341503.full.pdf},
  journal   = {medRxiv}
}
R package (CRAN)
Lawless D. quantbayes: Bayesian Quantification of Evidence Sufficiency. Comprehensive R Archive Network (2025). https://CRAN.R-project.org/package=quantbayes
@article{quantbayes_cran,
  title        = {quantbayes: Bayesian Quantification of Evidence Sufficiency},
  author       = {Lawless, Dylan},
  year         = {2025},
  note         = {R package version 0.1.0},
  url          = {https://CRAN.R-project.org/package=quantbayes},
  doi          = {10.32614/CRAN.package.quantbayes},
  journal      = {Comprehensive R Archive Network},
  organization = {Comprehensive R Archive Network}
}
Software release (Zenodo)
Lawless D. Bayesian Quantification of Evidence Sufficiency quantbayes Implementation. Zenodo (2025). DOI: https://doi.org/10.5281/zenodo.17919369.
@article{lawless2025_zenodo_quantbayes,
  author    = {Lawless, Dylan},
  title     = {Bayesian Quantification of Evidence Sufficiency quantbayes Implementation},
  month     = dec,
  year      = {2025},
  journal   = {Zenodo},
  publisher = {Zenodo},
  doi       = {10.5281/zenodo.17919369},
  url       = {https://doi.org/10.5281/zenodo.17919369}
}
Data repository
We provide the universal macOS binary which runs natively on both Intel x86_64 and Apple silicon arm64 systems and the R package source code. Release artefacts and documentation are hosted on Zenodo.
Licence
QuantBayes is released under the MIT Licence. This permits inspection, reproduction, and integration into commercial, research, and clinical workflows without restriction.

